TL; DR
As the first piece of our DeFi series, this article aims to introduce the overview landscape and share knowledge collected around the several most major protocols. In this piece, we touched the overlap on the user base of Maker and Compound and will continue research on user base and systematic risks in the coming DeFi pieces. Keep an eye out for our continually refreshed dashboard and Reporting tools to download all the data. Also, we will keep sending DeFi related weekly newsletter for followers — subscribe to it on our website!
Introduction
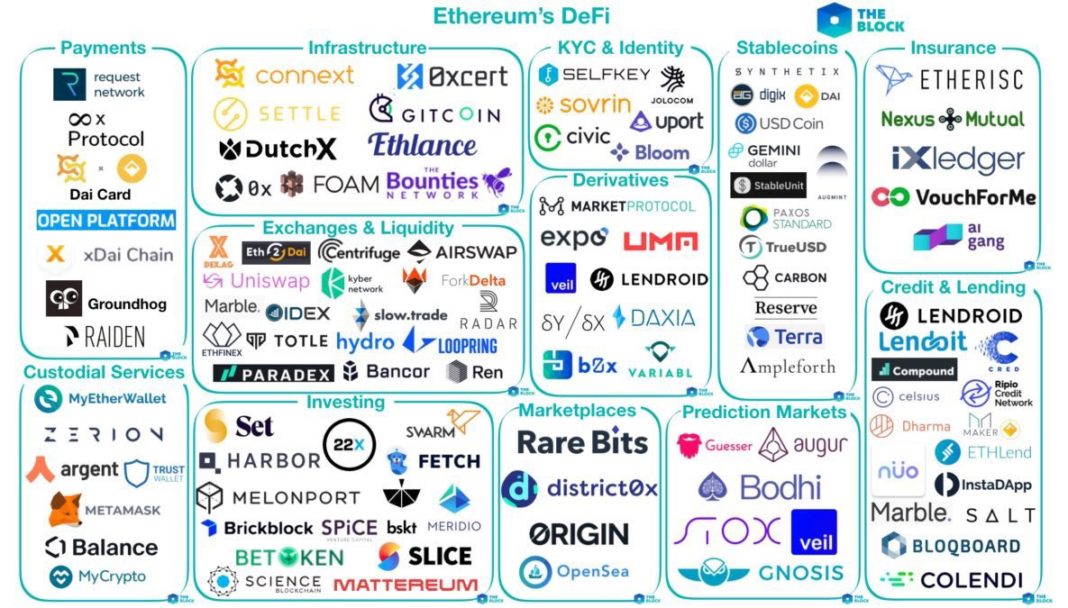
For the past few months, various projects have blossomed in decentralized finance space on Ethereum. Quoted from the block, below is the landscape picturing the DeFi ecosystem. The most trending protocols fall into exchanges & liquidity, derivatives, prediction markets, stable coins, and credit & lending categories. We will dive into examples for each of them later in this article.
As a concern raised from the community, a considerable amount of ETH are sent to those applications for collateralization purposes. Until April 25, over 2.2 million ETH has been locked up in DeFi platforms, which makes up over 2% of total ETH supply by then. Among them, Maker gathered the most — more than 90% out of 6 major DeFi projects (shown below).
Maker DAO & DAI
What is DAI?
DAI is collateral backed cryptocurrency that lives completely on the blockchain and does not rely on any mediator to ensure its stability and peg relative to the US Dollar. DAI is backed by collateral which is locked into audited and publicly available smart contracts.
How is DAI generated?
Maker uses a series of smart contracts deployed on the main net to back the value of the DAI stable coin through a system of Collateralized Debt Positions (CDPs), feedback mechanisms, and trusted third parties. It allows anyone to leverage ETH holdings to generate DAI stable coins.
Users that want to create DAI first open a CDP and then deposit ETH in the Maker CDP smart contract.
Technically it’s not ETH that is deposited, but PETH, or Pooled Ether. First of all, ETH is turned into WETH, or Wrapped Ether, which is essentially an ERC20 token that is minted 1:1 for ETH. Afterward, PETH basically acts as a share of a ‘pool of ETH’ — you deposit ETH, and get a share that you can redeem for the amount of ETH received. It’s worth noting that unlike ETH to WETH, ETH to PETH conversion rates are not 1:1. Currently, 1 PETH = 1.04 ETH — the reason behind this will be made clear a bit later.
The amount of DAI that the user creates relative to the ETH it deposited is called the collateralization ratio. For example, if the collateralization ratio is 200%, and 1 ETH is worth 1000$ — when depositing 1 ETH to the collateralization contract, a user would be able to create 500 DAI. That 1 ETH is no longer in the user’s control — until the 500 DAI loan is paid back, the CDP is closed, and the DAI burned.
If the value of ETH fluctuates and the ETH value in the CDP drops enough that it gets close to the collateralization ratio — it runs the risk of entering liquidation. However, users have mechanisms at their disposal that lets them add more collateral unless the CDP is already in liquidation. The opposite is also true — and in the case of ETH appreciation that brings the collateralization ratio even higher — users have 2 options at their disposal. They can either issue fresh DAI based on the same collateral, or withdraw part of that collateralized ETH. Users can also transfer ownership of CDPs, pay back all the debt or close their accounts entirely.
However, when the collateral value for a CDP drops below the collateralization ratio, and the user doesn’t lock up more ETH — that CDP gets liquidated. When this happens, it is acquired by the system, and the CDP owner receives the value of the leftover collateral minus the debt, Stability Fee, and Liquidation Penalty.
The PETH collateral is then offered for sale at a discount, which can be bought using DAI, until an amount equal to the CDP debt has been removed. If any DAI is paid in excess, the excess is used to purchase PETH from the market and burn it, which positively changes the ETH to PETH ratio (hence 1 PETH = 1.04 WETH = 1.04 ETH) .
A CDPs lifecycle is defined in 6 stages (according to the purple paper)
Some implications:
- Collateral-increasing actions are allowed until Grief.
- To draw is only allowed during Pride, while free is also allowed during Anger.
- To give\ transfers ownership of a CDP. is allowed at any time, including during liquidation.
- Each of the liquidation actions corresponds to its own stage.
Risk Management: The MKR token. MKR is an ERC-20 token which is created/destroyed in response to DAI price fluctuations in order to keep it hovering around $1 USD. Aside from being used to pay the stability fees on the system, the holders of the MKR token are responsible for voting on performing a number of risk management actions. They can add or modify existing CDP types (currently only single collateral CDPs), change the DAI savings rate (unused currently — a part of the switch to multi-collateral CDPs), choose the set of oracles that help determine accurate collateral prices (properly incentivized external actors which report prices), choose a set of emergency oracles which have the ability to trigger an Emergency Shutdown, and finally, the voters can instantly trigger Emergency shutdown themselves if enough voters deem it necessary (Emergency Shutdown is the mechanism used in case (Emergency Shutdowns can occur due to technical updates or if the system is subject to a serious attack it can be used to mitigate that).

Above is showing by March 12, how the user community around Maker Collateral Pool look like. Green nodes are all the external accounts created CDPs and deposited into the liquidity pool. Some of them communicated through proxy contracts (blue nodes) and exchanged ETH for WETH first, and then deposited WETH into Maker SaiTub, while some of them sent WETH directly towards the Maker (green nodes around it). The total WETH volume makes up the total amount of ETH once locked up in Maker, which is ~2 million ETH by then. (*2% of total ETH supply and ~89% out of 6 major defi projects*)
Compound
The compound is a protocol on the Ethereum blockchain that uses a process of algorithmically determining interest rates for pools of tokens (called money markets) based on the supply and demand for each token. The money markets are unique to every ERC20 token and transparently record transactions and historical interest rates.
Users supply tokens to the platform directly, and earn a floating interest rate, without negotiating anything with their counterparties (conversely borrowers take loans of tokens from the platforms and pay the interest rates).
Instead of having suppliers and borrowers negotiate on terms and rates, the interest rates in the Compound protocol are computed using a model that follows the theoretical notion that increased demand should increase interest rates. Each money market undergoes this calculation, and thus each token has its own interest rate model — a function of that specific token’s utilization. Of course, the interest earned by suppliers is less than that paid by borrowers — to ensure the protocol’s economic stability and sustainability.
Why be a supplier? Or a borrower?
Money markets accrue interest in real-time, and offer complete liquidity — so users can view their balances (including interest) and withdraw them at any time. Long term holders can leverage their positions and use the money markets as an additional source of income.
Similarly, borrowers can instantly borrow tokens (they collateralize these loans — and similarly to Maker’s approach — users have to maintain a balance that covers the borrowed amount, and then some, to ensure solvency). Borrowers don’t have to wait for orders to fill, and they can easily leverage their existing portfolios to borrow tokens that they can instantly use somewhere else in the Ethereum ecosystem.
Platform usage
The table above summarizes the usage in the Compound platform so far. The simplest way to determine supply and demand forces and their influence on the interest is to look at the number of loans, lenders, and borrowers. Another interesting metric that could explain the higher interest rates, is the percent lent, which shows how much of the total supply was borrowed at one point — by the most borrowed tokens are DAI and WETH.
Token Exchange: Uniswap
Uniswap is a protocol that automates token exchanges on Ethereum. Inspired by a Reddit post from Vitalik, it is a set of smart contracts deployed to the main net. It doesn’t have a token (it actually has more than one, but more on that later), no centralized order books, and no amount of fees goes to the platform or its creator (but rather to the liquidity providers — so the users). At just under 30k ETH locked — this would be enough to put it in the top 5 DeFi platforms. This figure doesn’t take into account all the tokens locked though — tokens included, Uniswap is currently the 3rd largest DeFi platform (after Maker and Compound) in terms of value locked.
The way Uniswap works is it basically creates markets for each ERC20 — ETH pair. It allows anyone to deploy a contract that essentially creates a new exchange for each ERC20. These contracts will always hold a reserve of ETH and the associated token. Trades between two tokens are then facilitated by using ETH as an intermediary — all these contracts are linked together through a registry that keeps track of them. The uniswap_factory contract accomplishes both of these tasks — it acts as both a factory and a registry. Users can use the public create exchange() function to deploy an exchange contract for a new ERC20.
Traditionally, on centralized exchanges, users choose to make markets by providing liquidity at various price points that they would be satisfied in getting/paying — so they become market makers either on the buy side, the sell side, or both. The collection of orders from all traders that do this makes up the order book. On Uniswap however, liquidity is pooled together — on both sides of the trade. The markets are then made according to an algorithm. A feature of Uniswap that stands out — is the fact that it cannot run out of liquidity. Granted, a promise that sounds so far fetched cannot come without trade-offs. The trick that the Uniswap algorithm uses, involves increasing coin prices by an asymptotic function of the desired quantity. Basically, the more tokens you want on a single trade — the more you’re going to pay for them, hence the trade-off. No longer will whales be able to make huge trades, but at the same time — the system is always going to have liquidity — trades will always get completed.
What’s in it for the liquidity providers?
When providing liquidity to an exchange, this cannot happen on just one side of the pair — this would shift the ratio that essentially gives the token price (x token / y ETH = price), and with this change the provider will lose money through arbitrage.
After adding equally valued amounts of both ETH and token to the exchange contract for a said token, the provider is issued what are called liquidity tokens. These tokens essentially represent shares in the liquidity pool (provide 10% of the total liquidity of that pool — receive tokens that entitle you to 10% of the pool). These are simply records that tell how much liquidity providers are owed. Adding or removing liquidity, mints or burns liquidity tokens such that the relative share of the pool stays constant for everyone.
These were the hows, now onto the whys. The incentive to provide liquidity comes from the fact that for all trades, fees are paid. These fees go back into the liquidity pool so that even though providers are always entitled to the same percent of the liquidity pool, that percent is now worth more. There are no platform fees, only these swapping fees.
Fee Structure
- ETH to ERC20 trades
- 0.3% fee paid in ETH
2. ERC20 to ETH trades
- 0.3% fee paid in ERC20 tokens
3. ERC20 to ERC20 trades
- 0.3% fee paid in ERC20 tokens for ERC20 to ETH swap on input exchange
- 0.3% fee paid in ETH for ETH to ERC20 swap on output exchange
- Effectively 0.5991% fee on input ERC20
This chart shows liquidity providers for each token. Each color represents a token, each rectangle — a provider. The size of each rectangle is proportional to the amount of liquidity provided. The 2 biggest tokens on the left (green and gold) are DAI and MKR — apparently the most popular pairs.
Prediction Market: Augur
Augur is a protocol that allows users to create prediction markets. These allow speculators to essentially bet on the outcomes of future events. These markets aggregate the predictions of participants and incentivize them to contribute to the pool of wisdom by rewarding those who are eventually proven to be right.
The markets follow a four-stage process: creation, trading, reporting, and settlement. Trading begins immediately after creation, and once the event occurs and its outcome is determined, users can close their positions and withdraw their payouts.
Market Creation
Anyone can create a market regarding a future event. The creator sets event end times and designates the reporter that will report the outcome of the event (Anyone reported outcome can be disputed by the community, in case the report is considered to be wrong). The creator also chooses a resolution source — this should be used to determine the outcome (can be almost any source). The fees that will be paid by those who settle the market to the creator are also decided.
Lastly the creator posts 2 bonds: the validity (paid for in ETH and refunded if the market doesn’t settle as invalid — it’s set based on the amount of recent invalid results and acts as an incentive for creators to only open unambiguous markets) and the no-show bond (paid in REP — it is returned to the creator only if the designated reporter submits the report during a 3 day period — it incentivizes the choosing of reliable reporters so that markets are resolved quickly).
Trading
The outcomes of events are traded by means of shares in that outcome. When users buy shares for a possible outcome for a market, they essentially bet ETH on one outcome or the other, after which Augur’s matching engine creates a complete set of shares that consists of one share of each possible outcome.
An order book is maintained for all of the markets created, and orders can be created or filled at any time and for any market. This may involve trading with other users, or the creation of new sets of shares. Traders set a minimum price for their orders and if it cannot be filled in full, it is at least partially filled, with the rest placed again as a new order.
All the assets mentioned — Augur markets, shares in outcomes, participation tokens, shares in dispute bonds — are tradable and transferable at any time.
Reporting
Once the event that the market was created to predict occurs — it’s outcome determines the market to finalize and for settlement to begin. Oracles that are motivated by profit act as reporters and relate the real world outcome of the events. REP holders may participate in the reporting and eventual disputing of outcomes.
Market Settlement
Traders exit their positions by either selling their shares to others or by settling with the market.
When creating a market, users can specify a description, and also some tags to help describe the scope of that market. The chart above is a word cloud built from the Augur market tags used so far. (They were extracted and decoded from the data field of the topics that the Augur smart contract generated when the create market event is fired).
User overlap analysis — Maker & Compound
From what we’ve shown so far, the only 2 protocols that share a market (check the first chart, bottom right corner — Credit & Lending) are Maker and Compound. They also happen to be the 2 biggest protocols to date (granted, Maker is an order of magnitude larger). Thus, it would make sense to take a look at their user bases.
For Maker, this would be made up of those who opened CDPs, and for Compound by both the suppliers and borrowers, as these 2 categories are equally important to the platform. Whereas in Maker, those who lock ETH (CDP openers) usually also borrow DAI, in Compound, you can either be a supplier, a borrower, or both.
475 unique borrowers for Compound (2,549 borrows)
- 230 users with 1 borrow
- 136 users with 1 to 5 borrows
- 54 users with 5 to 10 borrows
- 55 users with 10 or more borrows (7 of which have more than 50, and the max being 171)
3,116 unique suppliers for Compound (10,956 supply actions)
- 1,527 users with 1 supply
- 1,133 users with 1 to 5 supplies
- 338 users with 5 to 10 supplies
- 199 users with 10 or more supplies (4 of which with over 100, and the max at 160)
7,518 unique CDP openers on Maker (16,848 CDP opens)
- 6,308 users with 1 CDP
- 1091 users with 1 to 5 CDPs
- 91 users with 5 to 10 CDPs
- 28 users with 10 or more CDPs (2 of which have more than 1,000 CDPs — 1360 and 4,893 respectively)
From the total of 30,353 actions in total (which will correspond to the edges in the next graph, but since there is no point in keeping them all as they’ll only clutter the graph, only 11,109 are included — one between each of the unique nodes), there are 9,539 unique addresses (these will be the nodes).
At a glance, we notice the size difference between the 2 platforms, a large group of addresses in between them (and other smaller ones towards one or the other) as well as some rings formed around the nodes representing Maker and Compound. Let’s describe what these groups are, to help better understand what the chart can tell us. First, it would help to think of the Maker and Compound nodes as having a sort of ‘gravity’. The closer a node is to them, the more interactions it had.
The large group in the middle: around 775 addresses that interacted with both protocols in equal or close to equal amounts (1–2 interactions with each).
Each of the smaller groups formed to either side of this one are addresses that interacted with both protocols, but gravitated towards one by having more interactions with it. The closer the groups are to one platform or the other, the more interactions this means it had with it. For example, the small red-ish nodes we see really close to Maker — these are users that opened a lot of CDPs (close to 10 or more) , and only had 1 interaction with Compound.
Similar interpretations can be given to the users that bundled in halos around the platform nodes. The outermost circle — 1 interaction. Move 1 step closer — 2 interactions, and so on. Same goes for the ones we mentioned earlier as being the users with the most interactions. For example the address that opened 4,893 CDPs (more than 1/4 of the total CDPs opened can be attributed to 1/7518 of the users, with almost 1/2 being opened by 3/1000 of users!) can be seen as overlapping the Maker node (hard to see in this picture, but zoom in and you can just make it out near the ‘k’) .
Among all the accounts (3,318 distinct users on Compound, and 7,518 on Maker), there were 1,223 common addresses interacting with both these 2 protocols. Percentage wise — we can say that 37% of the users that interacted with Compound also opened CDPs on Maker at some point. Similarly, 16% of those who opened CDPs on the Maker platform, also supplied or borrowed tokens to/from Compound.


